Showing posts with label debug. Show all posts

Thursday, May 26, 2016

Symbolicating bitcode crash logs in XCode

As of Xcode version 7.3 there is still a problem with symbolicating the bitcode crash logs. I've attempted several solutions, here and here, but here is what I came to:

1. Crash logs provided are for the dSYMs that Apple also provides. Just go to the iTunes connect and download them:
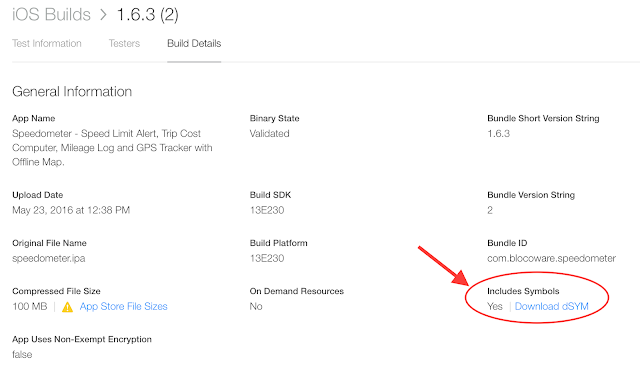


Once you have them right click on the crash in xcode -> "Show in finder" and copy to some target directory - that's actually a crashpoint file you are going to get.

My target directory is now ~\Desktop\crashes and here is how it looks:
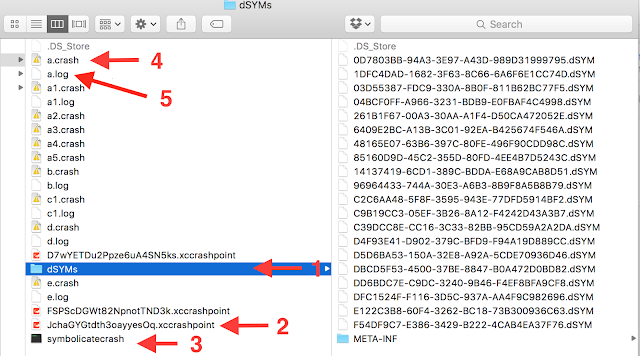


Where #1 are dSYMs as copied from the iTunes connect. #2 is the crashpoint saved from the crash organizer window in xCode. #4 is a crash log extracted from the crashpoint file (right click and "show package contents")

To get #3 - a symbolicatecrash app, execute this in the target directory (xcode 7.3):

cp /Applications/Xcode.app/Contents/SharedFrameworks/DVTFoundation.framework/Versions/A/Resources/symbolicatecrash symbolicatecrash

For different versions of xcode the location of symbolicatecrash will be different.

To get symbolicatecrash ready to operate execute:

export DEVELOPER_DIR='/Applications/Xcode.app/Contents/Developer'

Only one step is left! That's to get your crash log symbolicated:

./symbolicatecrash a.crash dSYMs/ > a.log

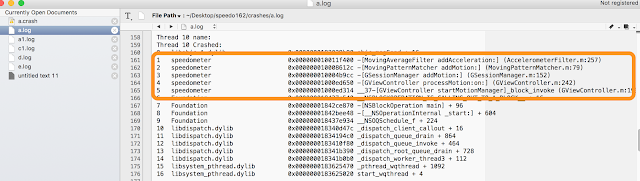
And the output file a.log is looking like:


Way better, is not it?

There are nuances that I would not touch here, like these dSYM files you downloaded are for different architectures and it would be the best to match your specific crash log to a corresponding dSYM. I'll leave this detail to you, my experience is that function names do match quite well, then it is just about the line of code information you'll be getting. In above picture, given crash and dSYM are matched well, you can see the line of code where the crash exactly happened. Otherwise you'd see +xyz there and that's not that helpful.

This is it. Please don't judge me strictly, I'm not an expert in any field, as I learnt over time :)! Knowing more than I do? Share your knowledge in the comments!

Yours,
Stan.

Monday, December 7, 2015

So, here is my string dump for x64 in windbg

Based on this and that.

$$>a<"c:\_install\dumpstringtofolder.txt" 000007feed816500 1000 c:\temp\stringtest

and the script:

$$ Dumps the managed strings to a file
$$ Platform x64
$$ First argument is the string method table pointer
$$ Second argument is the Min size of the string that needs to be used filter
$$ the strings
$$ Third is the path of the file
.foreach ($string {!dumpheap -short -mt ${$arg1}  -min ${$arg2}})
{
r@$t0=  poi(${$string}+8)*2
.writemem ${$arg3}${$string}.txt ${$string}+c L? @$t0
}

The only other thing I needed this time is this on one of the strings:

!gcroot 0000000100e769f0

To see:

   ->  0000000180006d08 System.Web.Caching.CacheMultiple
            ->  00000001800069c8 System.Web.Caching.CacheCommon
            ->  00000001800034a8 System.Web.RequestTimeoutManager
....
            ->  00000004021b5740 System.Web.SessionState.InProcSessionState
            ->  00000004021b5288 System.Web.SessionState.SessionStateItemCollection
....
            ->  0000000289779a58 ASP.ordercomposer_orderedit_aspx
            ->  000000018c14fe38 XYZ.Ordering.Modules.OrderingViewStatePresister

So this time the root of the problem was in keeping viewstate in the session and not really purging not needed view state away. This was one of the legacy apps and reminded everyone the old none-tasty view state solution from MS :). Viva MVC and looking forward the day with no legacy ASP.NET apps we need to support :)!

Friday, April 1, 2011

WCF: Memory leak with TypedMessageConverter when using XmlSerializer

Ok, hint is given in the title, but here is the code for you to observe and tell before you go any further what kind exactly of memory leak its causing and why :).

   1: private Message CreateResponseMessage(GetServiceStatusResponse result, Message message)
   2: {
   3:     TypedMessageConverter converter = TypedMessageConverter.Create(typeof(getServiceStatusResponse1), "*", "http://www.sitronics.com/V2/SCAdapter", new XmlSerializerFormatAttribute() );
   4:     
   5:     Message reply = converter.ToMessage(new getServiceStatusResponse1
   6:     {
   7:         GetServiceStatusResponse = result,
   8:         OutboundServiceData = new OutboundServiceData { MsgCorrelations = new OutboundServiceDataMsgCorrelations { CorrelationID = RouterService.CorrelationId } }
   9:     }, OperationContext.Current.IncomingMessageVersion);
  10:  
  11:  
  12:     RouterService.CopyRequestToReply(message, reply);
  13:  
  14:     return reply;
  15: }

Previous debugging points into classic assembly heap loader leak with XmlSerializer temp assemblies (here is the example for how to debug from Tess: http://blogs.msdn.com/b/tess/archive/2006/02/15/532804.aspx)

It is obvious that there should be XmlSerializer somewhere inside. Road to finding it starts with how the TypedMessageConverter is created:

   1: public static TypedMessageConverter Create(Type messageContract, string action, string defaultNamespace, XmlSerializerFormatAttribute formatterAttribute)
   2: {
   3:     if (messageContract == null)
   4:     {
   5:         throw DiagnosticUtility.ExceptionUtility.ThrowHelperError(new ArgumentNullException("messageContract"));
   6:     }
   7:     if (defaultNamespace == null)
   8:     {
   9:         defaultNamespace = "http://tempuri.org/";
  10:     }
  11:     return new XmlMessageConverter(GetOperationFormatter(messageContract, formatterAttribute, defaultNamespace, action));
  12: }
  13:  

I’ll cut the story saying that inside that routes to creation of SerializerGenerationContext to instantiate the required serializers:

   1: private XmlSerializer[] GenerateSerializers()
   2: {
   3:     List<XmlMembersMapping> list = new List<XmlMembersMapping>();
   4:     int[] numArray = new int[this.Mappings.Count];
   5:     for (int i = 0; i < this.Mappings.Count; i++)
   6:     {
   7:         XmlMembersMapping item = this.Mappings[i];
   8:         int index = list.IndexOf(item);
   9:         if (index < 0)
  10:         {
  11:             list.Add(item);
  12:             index = list.Count - 1;
  13:         }
  14:         numArray[i] = index;
  15:     }
  16:     XmlSerializer[] serializerArray = this.CreateSerializersFromMappings(list.ToArray(), this.type);
  17:     if (list.Count == this.Mappings.Count)
  18:     {
  19:         return serializerArray;
  20:     }
  21:     XmlSerializer[] serializerArray2 = new XmlSerializer[this.Mappings.Count];
  22:     for (int j = 0; j < this.Mappings.Count; j++)
  23:     {
  24:         serializerArray2[j] = serializerArray[numArray[j]];
  25:     }
  26:     return serializerArray2;
  27: }
  28:  

This “pre-cached” set of serializers is then used:

   1: internal XmlSerializer GetSerializer(int handle)
   2: {
   3:     if (handle < 0)
   4:     {
   5:         return null;
   6:     }
   7:     if (this.serializers == null)
   8:     {
   9:         lock (this.thisLock)
  10:         {
  11:             if (this.serializers == null)
  12:             {
  13:                 this.serializers = this.GenerateSerializers();
  14:             }
  15:         }
  16:     }
  17:     return this.serializers[handle];
  18: }
  19:  
  20:  

And just to complete the cycle of information, here is the inners of the XmlSerializer to return serializers from mappings:

   1: [PermissionSet(SecurityAction.LinkDemand, Name="FullTrust")]
   2: public static XmlSerializer[] FromMappings(XmlMapping[] mappings, Type type)
   3: {
   4:     if ((mappings == null) || (mappings.Length == 0))
   5:     {
   6:         return new XmlSerializer[0];
   7:     }
   8:     XmlSerializerImplementation contract = null;
   9:     Assembly assembly = (type == null) ? null : TempAssembly.LoadGeneratedAssembly(type, null, out contract);
  10:     TempAssembly tempAssembly = null;
  11:     if (assembly == null)
  12:     {
  13:         if (XmlMapping.IsShallow(mappings))
  14:         {
  15:             return new XmlSerializer[0];
  16:         }
  17:         if (type != null)
  18:         {
  19:             return GetSerializersFromCache(mappings, type);
  20:         }
  21:         tempAssembly = new TempAssembly(mappings, new Type[] { type }, null, null, null);
  22:         XmlSerializer[] serializerArray = new XmlSerializer[mappings.Length];
  23:         contract = tempAssembly.Contract;
  24:         for (int j = 0; j < serializerArray.Length; j++)
  25:         {
  26:             serializerArray[j] = (XmlSerializer) contract.TypedSerializers[mappings[j].Key];
  27:             serializerArray[j].SetTempAssembly(tempAssembly, mappings[j]);
  28:         }
  29:         return serializerArray;
  30:     }
  31:     XmlSerializer[] serializerArray2 = new XmlSerializer[mappings.Length];
  32:     for (int i = 0; i < serializerArray2.Length; i++)
  33:     {
  34:         serializerArray2[i] = (XmlSerializer) contract.TypedSerializers[mappings[i].Key];
  35:     }
  36:     return serializerArray2;
  37: }
  38:  
  39:  
  40:  
  41:  

So, now we can quite easily say what would be the problem of implementation on the top. Unmercifully, it leads to generating temp assemblies for the types in question every time it is called. Code snippets provided are to confirm and understand when/why that would happen or not.

So solution will be to “cache” the instance of TypedMessageConverter per type required, same as a usual solution when using XmlSerializer itself with “non-caching” constructors.

Tuesday, August 3, 2010

Silverlight plugin timeout in Firefox while debugging


FF silverlight plugin crash report 45 seconds just is not enough for me to jump over all of the hurdles when doing Silverlight debugging. Per new changes in Firefox (http://kb.mozillazine.org/index.php?title=Plugin-container_and_out-of-process_plugins&printable=yes), you’ll see the crash report after 45 seconds of plugin hanging, which is MUCH better than previous bringing the whole firefox down!

But it would not be Firefox if they have not had a setting for it!

Setting root is dom.ipc.plugins.enabled.npctrl.dll and you’ll get to it by entering about:config into the address bar:

change plugin timeout value in FF

My current setting is 5 minutes, normally VS 2010 is going crazy on me around that time of silverlight debugging anyway, surrounding me with zombies!

This it it and happy debugging to You :)!

Thursday, May 14, 2009

Setting a command breakpoint on a managed method in windbg

This is a combination of the Tess’s entry http://blogs.msdn.com/tess/archive/2008/04/28/setting-breakpoints-in-net-code-using-bpmd.aspx and Kristoffer’s http://blogs.msdn.com/kristoffer/archive/2007/01/02/setting-a-breakpoint-in-managed-code-using-windbg.aspx

The twist is in using directly !Name2EE and !DumpMT with setting a bp breakpoint with a command

First, getting the method table:

0:003> !Name2EE *!TestRWLocks.Program
Module: 790c1000 (mscorlib.dll)
--------------------------------------
Module: 00952354 (sortkey.nlp)
--------------------------------------
Module: 00952010 (sorttbls.nlp)
--------------------------------------
Module: 00932c5c (TestRWLocks.exe)
Token: 0x02000002
MethodTable: 00933030
EEClass: 0093136c
Name: TestRWLocks.Program
--------------------------------------
Module: 7a441000 (System.dll)
--------------------------------------
Module: 64891000 (System.Configuration.dll)
--------------------------------------
Module: 637a1000 (System.Xml.dll)

Second, finding the entry address:

0:003> !DumpMT -MD 00933030
EEClass: 0093136c
Module: 00932c5c
Name: TestRWLocks.Program
mdToken: 02000002  (C:\dev\spikes\TestRWLocks\TestRWLocks\bin\Debug\TestRWLocks.exe)
BaseSize: 0xc
ComponentSize: 0x0
Number of IFaces in IFaceMap: 0
Slots in VTable: 9
--------------------------------------
MethodDesc Table
   Entry MethodDesc      JIT Name
79286aa0   79104924   PreJIT System.Object.ToString()
79286ac0   7910492c   PreJIT System.Object.Equals(System.Object)
79286b30   7910495c   PreJIT System.Object.GetHashCode()
792f7410   79104980   PreJIT System.Object.Finalize()
0093c021   00933028     NONE TestRWLocks.Program..ctor()
00c70070   00932ff8      JIT TestRWLocks.Program.Main(System.String[])
00c70160   00933004      JIT TestRWLocks.Program.RunForever()
00c701c0   00933010      JIT TestRWLocks.Program.DummyMethod(Int32)
0093c01d   0093301c     NONE TestRWLocks.Program.LockOnReaderWriterLock()

Finally, setting a breakpoint with a command:

bp 00c701c0 ".echo --> Calling DummyMethod;!clrstack -p;g"

Lets check if breakpoint is really set:

0:003> bl
0 e 00c701c0     0001 (0001)  0:****  ".echo --> Calling DummyMethod;!clrstack -p;g"

Monday, October 13, 2008

Debugging studies - day 3

Lab 5 was the longest one for me so far to get through. First I was not able to reproduce a bug actually. Tess may correct it in a way that it will be more reproducible, but in my case I had to read a review, so it took a lot of a thrill factor away.

In Vista Home I was not getting any extra application events in the log but this:

Faulting application w3wp.exe, version 7.0.6001.18000, time stamp 0x47919413, faulting module kernel32.dll, version 6.0.6001.18000, time stamp 0x4791a76d, exception code 0xe053534f, fault offset 0x000442eb, process id 0x%9, application start time 0x%10.

So no 0x800703E9 (means "Recursion too deep; the stack overflowed.") pointer here. Probably just me being reluctant once again to find how to get IIS7 on Vista Home to log those events (that is logged by default in IIS6). Or IIS7 handles it differently?

Taking advantage of having a review scanned, I executed the following adplus command to kill many birds with just one stone:

adplus -crash -pn w3wp.exe -o c:\dumps\ -ce 0xe053534f  -quiet

That got me the following:

image

For few moments I was really feeling as a smart guy, until I have uncovered the full meaning of "mini" in the custom exception dump. First warning was given when loading the sos, saying that its functionality is going to be limited. Secondly I was clearly able to see the StackOverflow happened, although no way I could even use ln or !ip2md in any reasonable manner to track it down (some of the nearby methods were mapped ok, some were not ...:( )

I tried -fullonfirst with -ce options, but no luck really; dumps on all of the 1st chance exceptions. Turns out Tess's custom adplus config file was not a nicety but the only (?) way how to tell adplus to create a full dump on the custom exception.

After re-using the config file (and given I had to scan the review in advance) the completion of the lab was really straight forward.

Sunday, October 12, 2008

Debugging studies - day 2

I started with Lab #3 today and faced a Windows Vista dummy question immediately - "Where do I setup performance counters/logs?". I bit of exploration led me to the reliability and performance monitor:

image

I just setup the user defined "Data collection set" and started the collection.

Overall, lab 3 was pretty straightforward and fast to complete.

New things I discovered for myself:


Loader heap.
I've seen already with clrprofiler what regex and serialization assemblies can do to the memory, but I didn't realize before that is a special loader heap that is used for them as well as for the regular assemblies to load.

Windows NT memory advanced details.
Whole range of things, driven by non-ability to answer Tess's questions:

Run !address -summary (this will give you an overview of the memory usage) and familiarize yourself with the output. Hint: check the windbg help files for !address Q: Which values corresponds best to the following: Private Bytes, Virtual Bytes
Q: Where is most of the memory going (which RegionType)?
Q: What does Busy, Pct(Busy) and Pct(Tots) mean?
Q: What does MEM_IMAGE mean?
Q: Under what region does .net memory fit in and why?


I continued with Lab 4 and found it very, very fascinating as regardless its name pointing to the high CPU usage, this high CPU usage resulted from the use of string concatenation instead of using a StringBuilder which in turn caused GC time to be up to 70%. That was a fantastic show-case for deciding when to use a StringBuilder over the string concatenation methods (like http://channel9.msdn.com/forums/TechOff/14294-C-string-vs-StringBuilder/) and example of how GC can kill your application performance. That was a tasty bit to debug!

Wednesday, October 8, 2008

The walkthrough through the debugging walkthroughs - my debugging studies. Day 1.

I've been committed for quite a while now to have some solid study on the production debugging. As I'm hang a little bit between 2 jobs right now I finally got time to realize it.

So, here I'm to describe my progress to the friends and share some bits and pieces I found interesting.

Long time ago I started with John Robbin's book: Debugging Microsoft .NET 2.0 Applications. As of that time I was not really into WinDbg debugging (I was interested, but not really committed), so that section from the book really escaped from me. But I benefited quite a lot from some of the other advanced debugging concepts provided there.

This time, I started with series of labs that Tess accumulated on her blog: http://blogs.msdn.com/tess/pages/net-debugging-demos-information-and-setup-instructions.aspx

I made a mistake for the first lab that I looked into the code of BuggyBits web site, so it was not really a "eureka" type of troubleshooting for me.

Nevertheless, after the first lab I considered reading this book as quite beneficial:http://www.microsoft.com/downloads/details.aspx?FamilyId=1644C14D-4152-4975-B1C2-A81BDFD6C30F&displaylang=en - Production Debugging .NET applications.

To give you some taste, few interesting bits I found there:

By default, events are only logged in the application event log if the recycling occurs based on the memory limit trigger. If you want IIS to log all
proactive recycling events to the application event log, run the following command from the \Inetpub\Adminscripts directory:
cscript adsutil.vbs set w3svc/apppools/<defaultapppool>/LogEventOnRecycle 0xffffffff

...

You can reconfigure WAS to prevent the failed process from serving any more requests, while ensuring that the process continues to run; this is known as orphaning the failed process. An orphaned worker process is removed from the application pool, but left in its failed state for later debugging. In this case, the WAS starts another worker process so that the application can continue to serve requests. To configure WAS to orphan worker processes upon failure, run the following command from the \Inetpub\Adminscripts directory: 
cscript adsutil.vbs set  w3svc/apppools/orphanworkerprocess 1
This command applies this setting at the master level for all application pools. To apply this setting to a specific application pool only, run the command as follows:
cscript adsutil.vbs set w3svc/apppools/<nameofapppool>/orphanworkerprocess 1

...

Large Object Heap Size displays the current size, in bytes, of the large object heap. Note that this counter is updated at the end of a garbage collection, not at each allocation.

And many more! In the middle of my reading, I returned to the second lab of Tess's and progressed with labs execution, this time always looking in the debugger first, not the code :)!


Side note - let me stop for a bit to describe my lab environments:

1. Windows Vista Home Premium (IIS7) - my very own laptop

2. Windows 2003 R2 Server Enterprise Edition - evaluation edition available as a virtual image from MS downloads, running on my laptop again (ignore all of the VPC compatibility message boxes, it just works)

I thought I'd have issues with running labs on Windows Vista Home Edition, but as for my second day now I have not  encountered any real problems:
- I had to set the app pool for ByggyBits to run under local system, as I didn't want to be figuring out why it can't really access the asp.net temp folder (as some are saying there is genuine limitation in Vista Home not using windows impersonation/authentication).
- I had to install IIS6 resource kit on my W2003R2 virtual image and rip tinyget out of it, as I was not able to find IIS7 resource kit or tinyget alone. IIS6 resource kit denied to install on Vista Home machine.

So at some point I dumped the W2003R2 machine and continued on Vista Home Premium.


So the second lab Tess provides the following message for the process crash in the event log:

A process serving application pool 'DefaultAppPool' terminated unexpectedly. The process id was '4592'. The process exit code was '0xe0434f4d'. For more information, see Help and Support Center at http://go.microsoft.com/fwlink/events.asp.

As I have never seen before what is logged on IIS7 for the same crash conditions, I was quite pleased seeing the following helpful message:
An unhandled exception occurred and the process was terminated. Application ID: /LM/W3SVC/1/ROOT/BuggyBits Process ID: 6068 Exception: System.NullReferenceException Message: Object reference not set to an instance of an object. StackTrace: at Review.Finalize()

That provides much better info! So answering Q3 from section 1 ("Q: Can you tell from the eventlogs what it was that caused the crash?") becomes pretty possible at this stage already: It is an exception in the finalizer, it runs in the non-request thread so it will bring down the process per .NET 2.0 unhandled exceptions policy. Does anyone from the .NET team added AppDomain.CurrentDomain.UnhandledException logging handler :):)?

Compared to the walkthrough, on vista I was not able to find a re-thrown exception different from the original, if anything was re-thrown then it was the original exception in my opinion. The !analyze command gave me the most of the information (and the stack trace was in the _remoteStackTraceString field).

From the time perspective (not counting the book), it took me about 4 hours to get to this point (setting up the environment, VM, etc). Enough for a day!